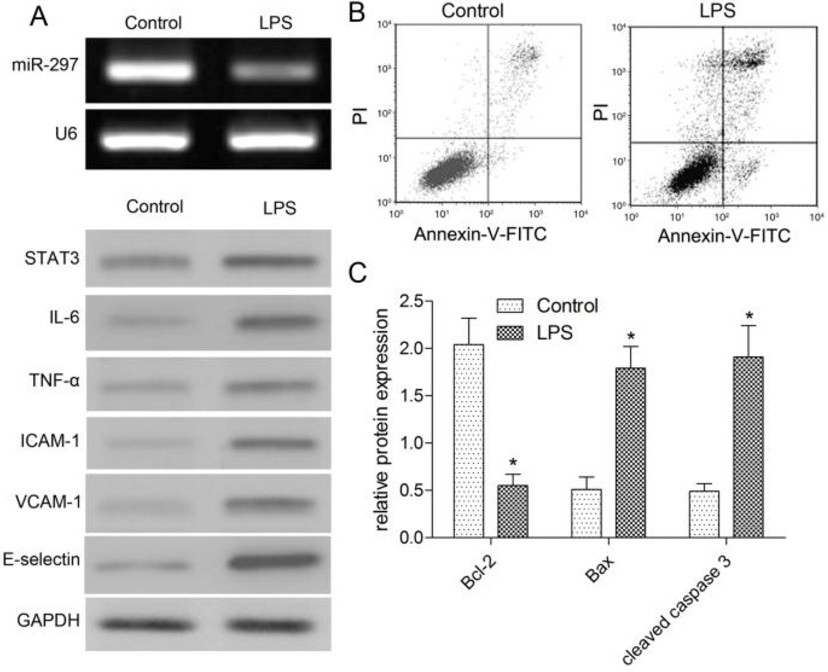
Fig. 1. LPS induces inflammatory response and apoptosis in HUVECs. (A) HUVECs were incubated with different concentrations of LPS at different time points. MiR-297 expression was detected with RT-PCR and normalized to endogenous U6. STAT3, inflammatory cytokines (IL-6 and TNF-α), and adhesion molecules (ICAM-1, VCAM-1 and E-selectin) were determined by Western blot analysis. Band intensities were measured by densitometry. Variations in protein levels were expressed as fold change compared with control after normalization to GAPDH. HUVECs administrated with 0.01M PBS were used as control. (B) The percentage of apoptotic cells was detected by Annexin V-FITC/PI double staining and flow cytometry analysis. (C) Apoptosis-related proteins were measured by Western blot. Each experiment was performed in triplicate independently. Asterisks indicated statistically significant differences. Data was represented as means ± SD. * P < 0.001, v.s. control.